Know all the elements of tradEAsy

With the trading library, you can learn how all the components work. Review the list and access each element to learn more information about it.
Indicators
This is the list of items that technical indicators use to configure the rules.
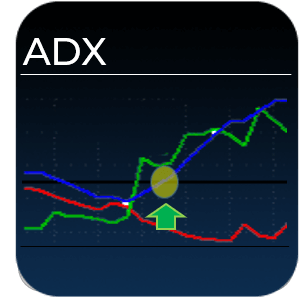
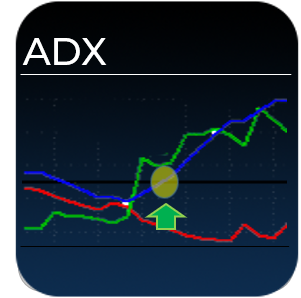
ADX
Bollinger
Bands that surround the price, calculated from the projection of the standard deviation on a moving average. +info
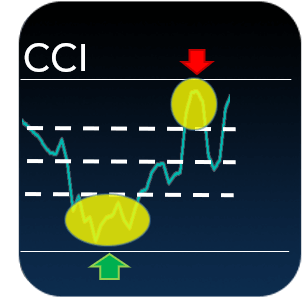
CCI
Oscillator marking the overbought and oversold zones of the market. +info
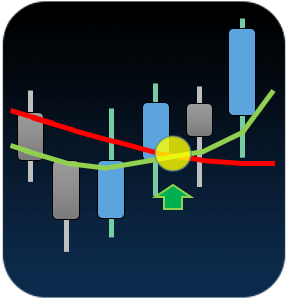
Moving Average Crossover
The reading of two settings of the moving average indicator. The signal is interpreted at the location or crossing of the fast and the slow mean. +info
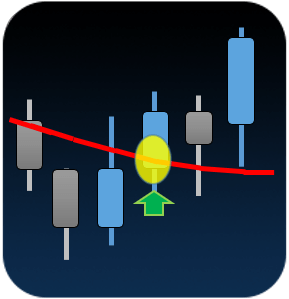
Price Average-Crossover
Indicator based on the average of the prices of the last candles. Reading comparing the current price with the average. +info
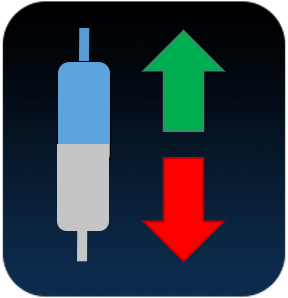
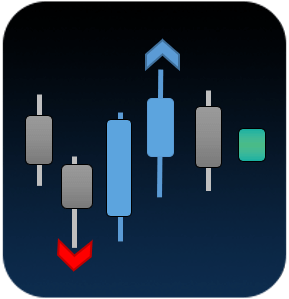
Candle direction
Element that identifies the direction of the last candles, being able to validate if they are bullish or bearish. +info
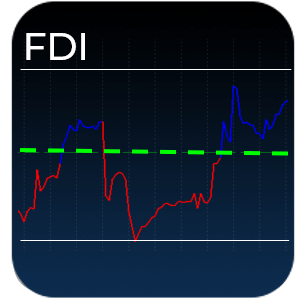
FDI
FDI is an indicator that helps us see the degree of definition of a trend. +info
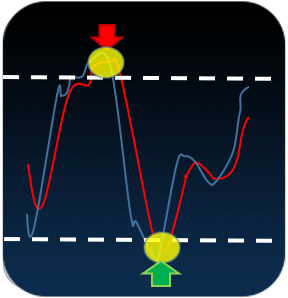
Stochastic
Oscillator that tells us if the current price quote is overbought or oversold compared to past quotes. +info
Heiken Ashi
An indicator that draws Japanese candle softer than conventional ones, to give greater traceability to trend movements. +info
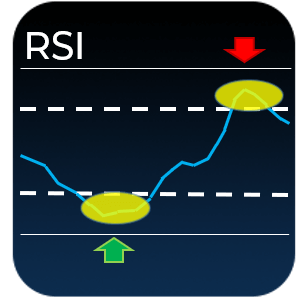
RSI
It is the classic oscillator to determine if there is overbought or oversold in the current price compared to the previous candles. +info
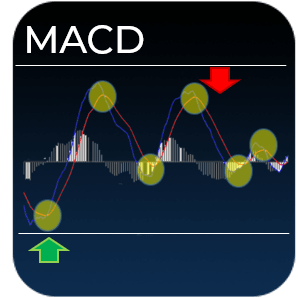
Indicador MACD
Oscillator that indicates the direction and maturity of the trend, based on the price movement in the last candles. +info
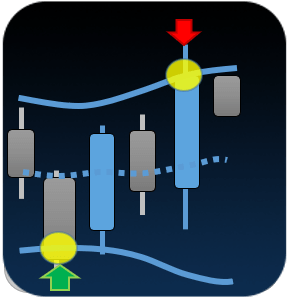
Parabolic SAR
Indicator used to define the direction of the trend, widely used as a location zone for exit rules. +info
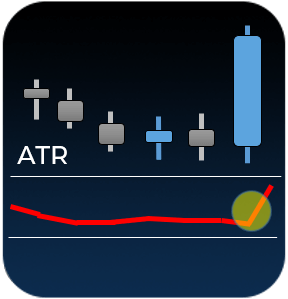
Candles vs ATR
This item compares the size of the current candle against the ATR indicator, which indicates the average volatility. +info
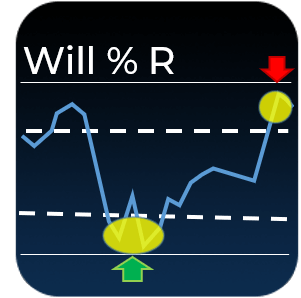
Williams %R
An oscillator that measures the overbought and oversold level in the market. +info
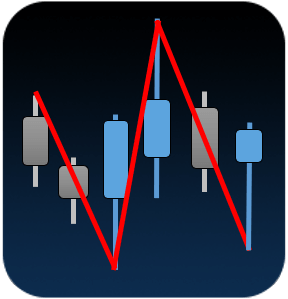
ZigZag
Indicator used to define trend segments from beginning to end, tracing the sections of trend changes. +info
Levels
Here you have all the items based on price levels.
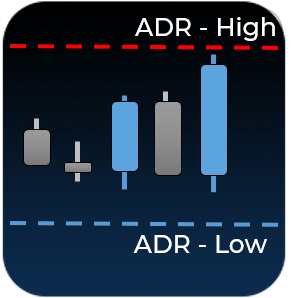
ADR
Indicator that projects the average range of the last N days, projected that range up and down from the opening price. +info
Fractals
It is an indicator that represents the points of relevant highs and lows, considering the 2 previous candles and 2 later candles to confirm. +info
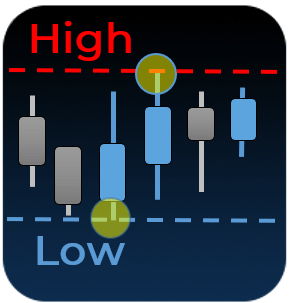
High/Low
Element that verifies the exceeding of the highs or lows of the last N candles. +info
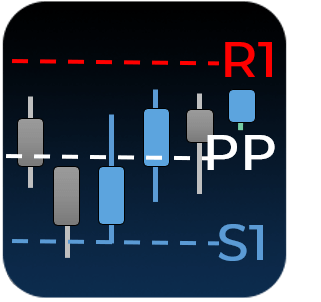
Pivot Point
They are the levels that project, from the opening price, the expected support and resistance of the day. +info
Time events
All the elements related to some temporary factor.
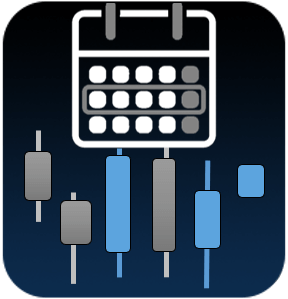
Daily calendar
Element to configure the rules according to the day of the week. +info
Time filter
Element to configure a filter rule according to the range between start time and end time. +info
Fixed time
An element that will activate a rule at a certain time. +info
Order events
Here are all the conditions related to what happens in the orders.
Accumulated profit
Analyze how much is the accumulated profit of all open orders. +info
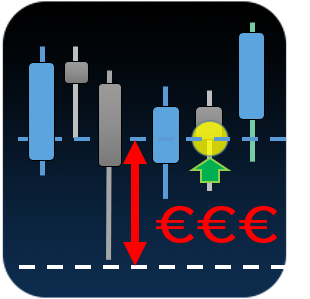
Cash profit
Determine the cash profit ($ or €) of an order or a group of orders. +info
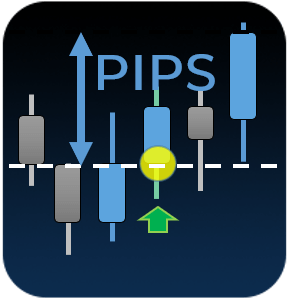
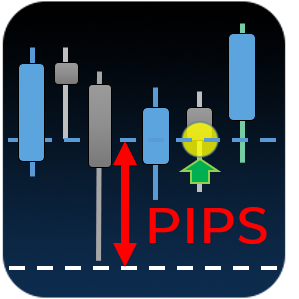
Pips Profit
Measures the amount of profit pips in an order, or a group of orders. +info
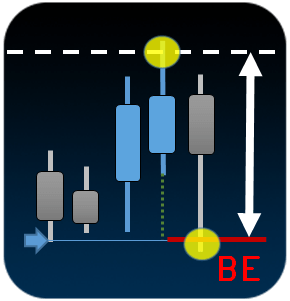
Break Even
Element that verifies if an order has reached a certain number of pips, to execute its exit in case of returning to the entry price. +info
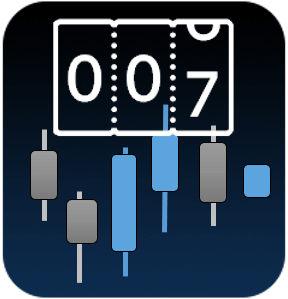
Orders Account
Element that will validate the number of open operations in the market. +info
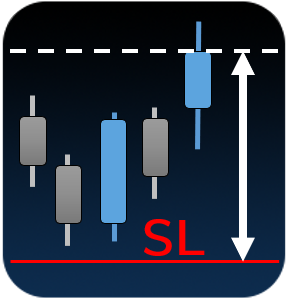
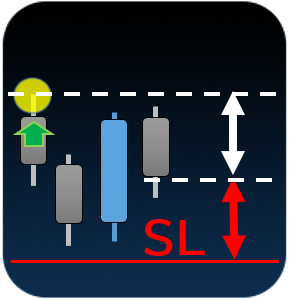
Stop Loss Distance
Measures the distance between the actual price and the stop loss level of a certain order. +info
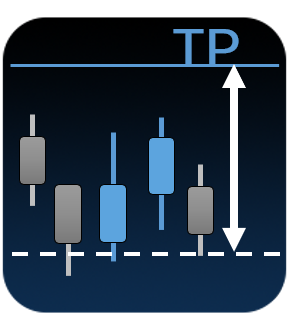
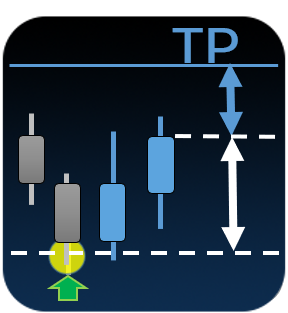
Distancia Take Profit
Measures the distance between the actual price and the take profit of a certain order. +info
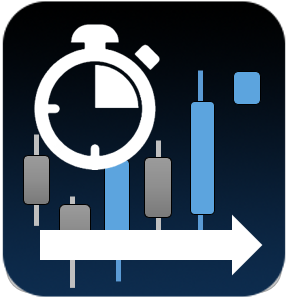
Wait time
Analyze the elapsed time in seconds, minutes or hours, since an order has been opened. +info
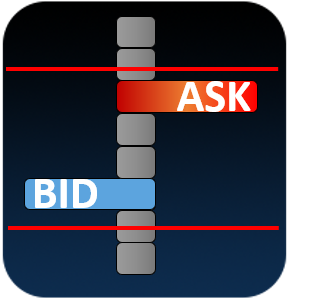
Spread filter
Condition to filter orders according to the amount of spread (difference between Bid Ask). +info
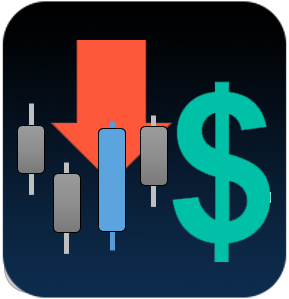
Accumulated Loss
Analyze how much is the accumulated loss of all open orders. +info
Cash losses
Determine the cash loss ($ or €) of an order or a group of orders. +info
Pips losses
Measures the amount of pips of loss in an order, or a group of orders. +info
Stop Loss Percentage
Measures the percentage distance of the price with respect to the Stop Loss, considering the route from the entry price. +info
Take Profit percentage
Measures the percentage distance of the price with respect to the Take Profit, considering the route from the entry price. +info
Señal inversa
An element that is activated when an order of the opposite sign is opened. +info
Trailing Stop
An element that verifies if an order has reached a certain distance of pips, in order to execute its exit in case of returning to the established distance. +info

Free webinars
Sign up for our free webinars. You will have training, access to workshops, and even competitions with prizes!

Personalized support
We can give you all the necessary support so that you get the most out of tradEAsy and achieve your trading goals.
Do you have any questions?
We are here to help you.
Sign up for your free account