What is RSI?
An element that obtains information from the RSI to identify the signals
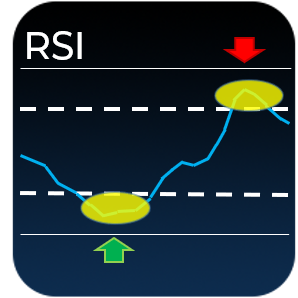
The RSI is a technical indicator that is useful to identify oversold and overbought levels
Overbuy indicates that the underlying price is too high and we should take into consideration that, usually, the bullish force tends to wear out
Oversell indicates that the underlying price is too low and we should take into consideration that, usually, the bearish force tends to wear out.
From the RSI, we are able to set up the periods of the RSI but also to define the lines of the levels of overselling and overbuy.
By default, the most common values will be assigned. These values are 14 periods, overbuy value of 70 and oversell the value of 30. We can also set up the timeframe.
The signal of overselling can be used either for buyouts or sales (by default, buyout)
The signal of overbuying can be used either for buys or sells (by default, sale)
Moreover, you can define the type of signal that you want between the following 3:
- Inside the overbuy/sell level: The element will give a signal while it is inside the oversell and overbuy.
- Cross when entering the overbuy/sell level: The element will give a signal when the level crosses from outside to inside.
- Cross when exiting the overbuy/sell level: The element will give a signal when the level crosses from inside to outside.