What is MACD?
The MACD is a technical indicator that shows the relationship between two moving averages of a security’s price and it shows the difference as a histogram. If it is below 0, it indicates that the fast average is below the slow one. Otherwise, it is above. Moreover, you have a third signal which is based on a simple moving average, calculated based on the value of the difference between both exponential averages.
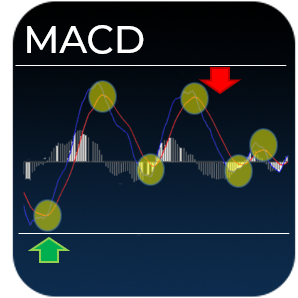
When the level of the histogram crosses above the level of signal we consider it as a buying signal since the fast exponential average will be increasing its distance from the slow one quite fast, coming from more stable movements (Inside the average of the differences). Otherwise, we will consider a selling signal.